There is an amazing game thought up by Spencer Easton and developed by Lean Communications, HUPS, and LeanTakt with Spencer’s help called Takt Towers. The game is based on the game Parade of Trades by the Lean Construction Institute, but it adapts the game to Takt methodologies.
The game is genius at showing the effects of pushing vs. building capacity and flow, so I will use it as an illustration about the effects of pushing in construction.
Takt Towers
You can use the game at this link: https://leancommunications.github.io/TaktTowers_11may_1_TaktPlanAndMore/
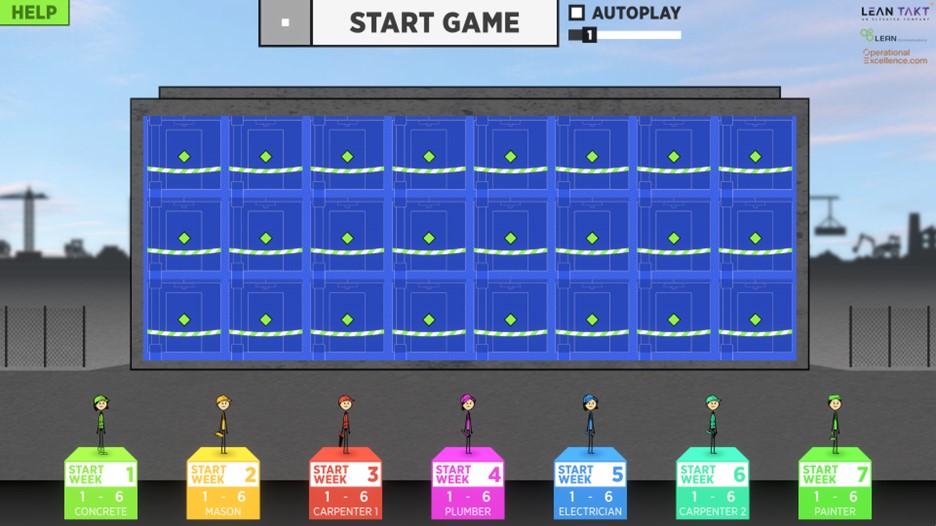
When you open the game, you will see this screen:
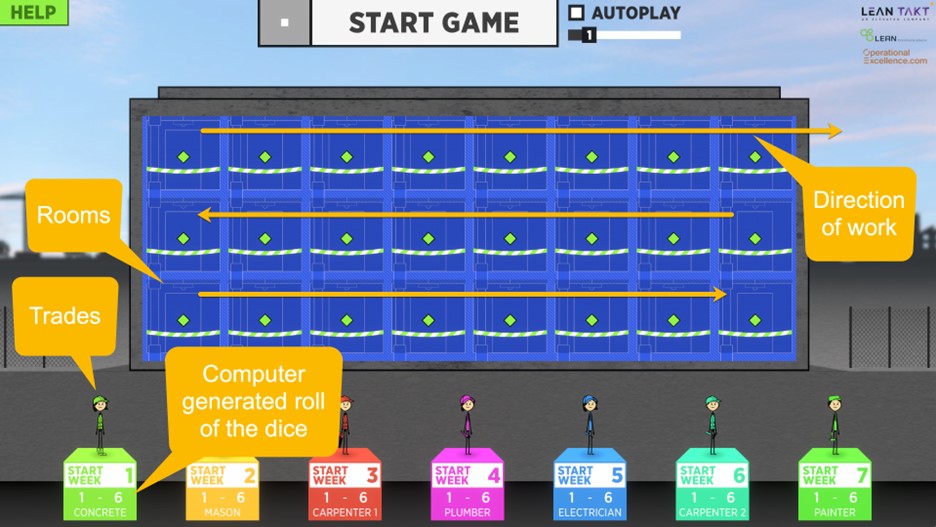
Here are what the objects represent:
- The people represent trade crews.
- The blue boxes represent rooms in the building.
- The 1-6 range is the computer-generated dice roll the computer will simulate during gameplay.
- The arrows in the image below show the direction of the trades as they work through the building.
When you play the game, the computer will roll the symbolic dice every time, deciding randomly what the number is for each trade’s turn. Each week the game is played the trades get to move their number forward; one number for one room. The trick is that they cannot move any farther past the trade in front of them. They keep rolling until they all get to the end just like in Parade of Trades.
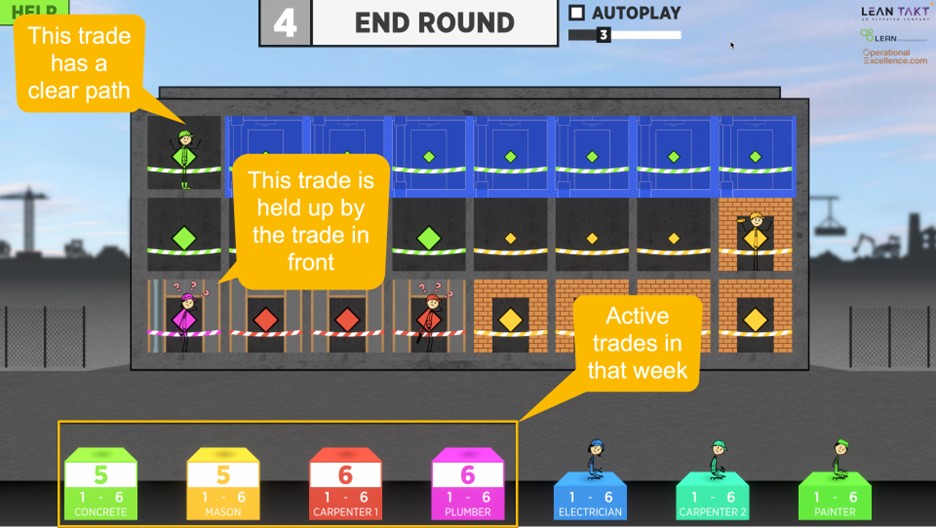
As you can see in the picture below, the green concrete crew is out ahead with plenty of space on week 4. The purple plumber is frustrated because she can do 6 rooms but only 1 was available to her. You can see the frustration with the question marks.
The dice represent the capacity to do work. A 1 roll means there is a slowing to the work or a roadblock in the work that limits the amount of work to be done. A 6 means full production and full steam ahead.
Now that you have the rules, let’s play four scenarios:
First Scenario:
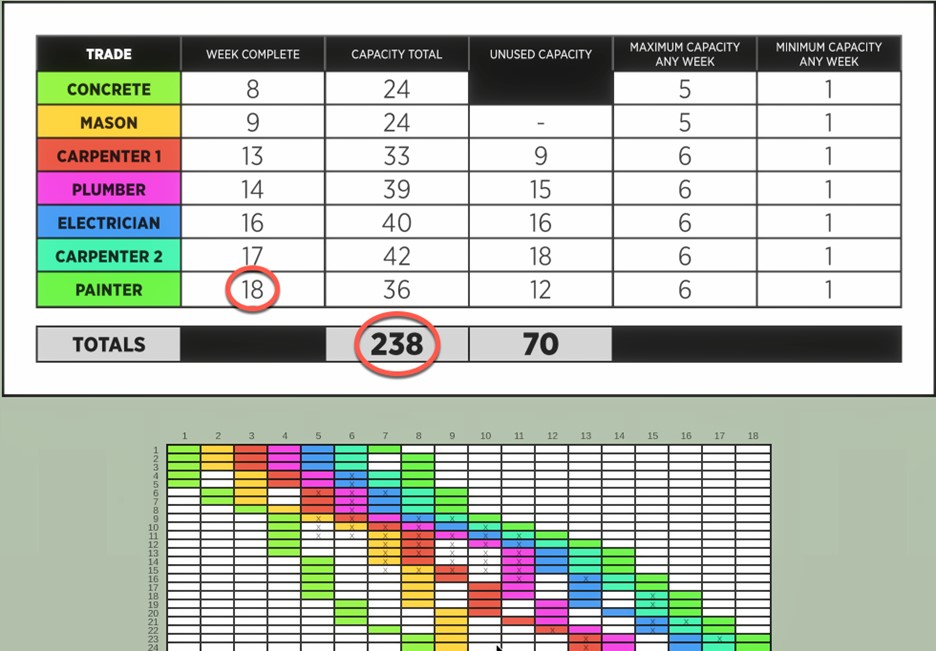
Let’s set the dice range between 1-6 which means the work can go fast, but it can also be held up. If you let the computer run the simulation, it will end up with these results:
As you can see, the painter (last trade) finished on week 18 and the total labor count was 238. When you look at the genius Takt plan simulation Spencer and Lean Communications built below, you will see x marks showing where trades bumped into each other, and you will see blank cells where work did not take place in the middle of the sequence.
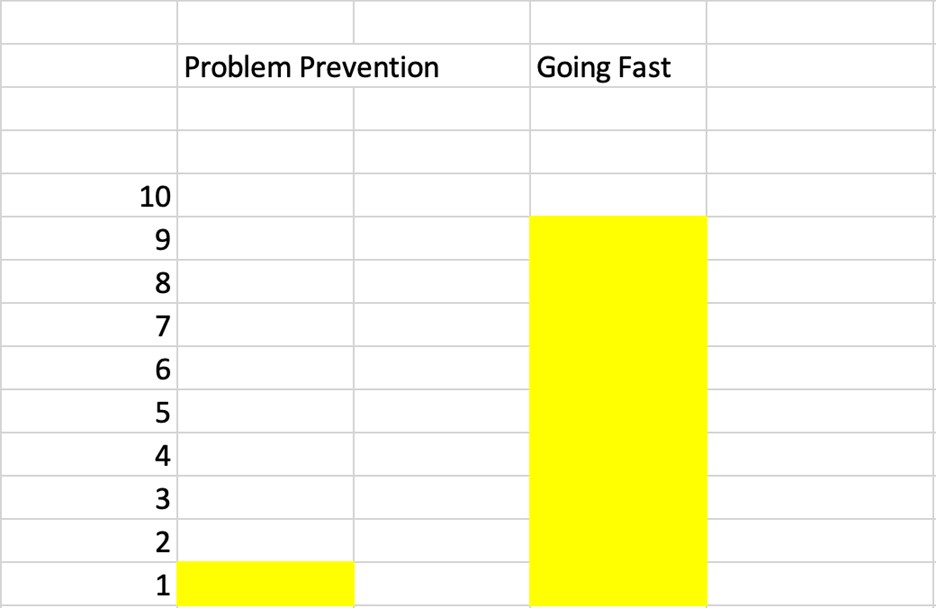
The reason the range is 1-6 is because the game is simulating a team that is spending its energy trying to go fast instead of prepare work. I have tried to illustrate this in the image below. If there are 10 units of team energy, the team is spending 9 of them on pushing and only 1 on preparation and capacity building. That is why they start and stop. They have not prepared and cleared the way.
Let’s see what happens with the…
Second Scenario:
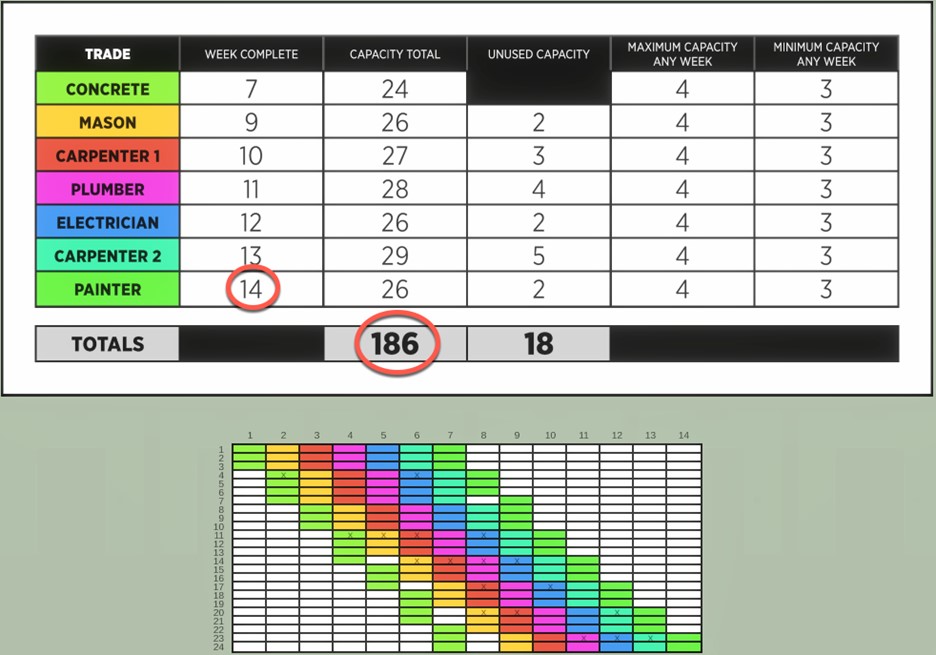
This time the dice range will be between 3 and 4, which means the work can go only so fast, and the lower die roll range is higher. That means the team is spending more energy preparing work and less energy pushing. If you let the computer run the simulation, it will end up with these results:
As you can see, the painter in this round finished on week 14, and the total labor count was 186. When you look at the Takt plan simulation, you will see x marks again showing where trades bumped into each other, and you will see blank cells where work did not take place in the middle of the sequence.
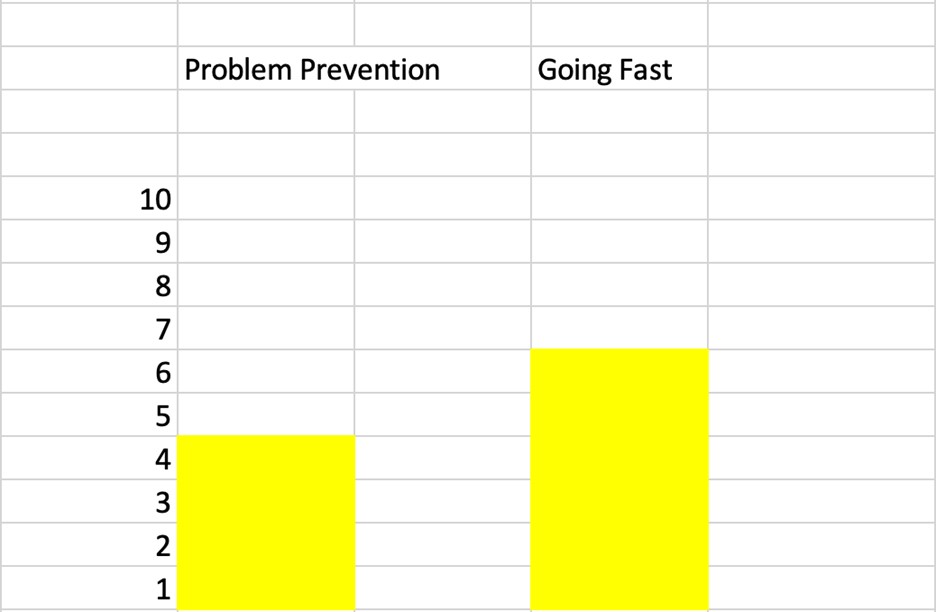
The 3-4 range served us well showing what happens when we spend less energy pushing and more energy preparing and creating stability. Below I show the energy spread. This simulation is showing the team putting 6 energy units into pushing and 4 into preparation.
So, we will do this simulation two more times. The next time will be a 3-3 range and the final one will be a 2-2 range:
Third Scenario:
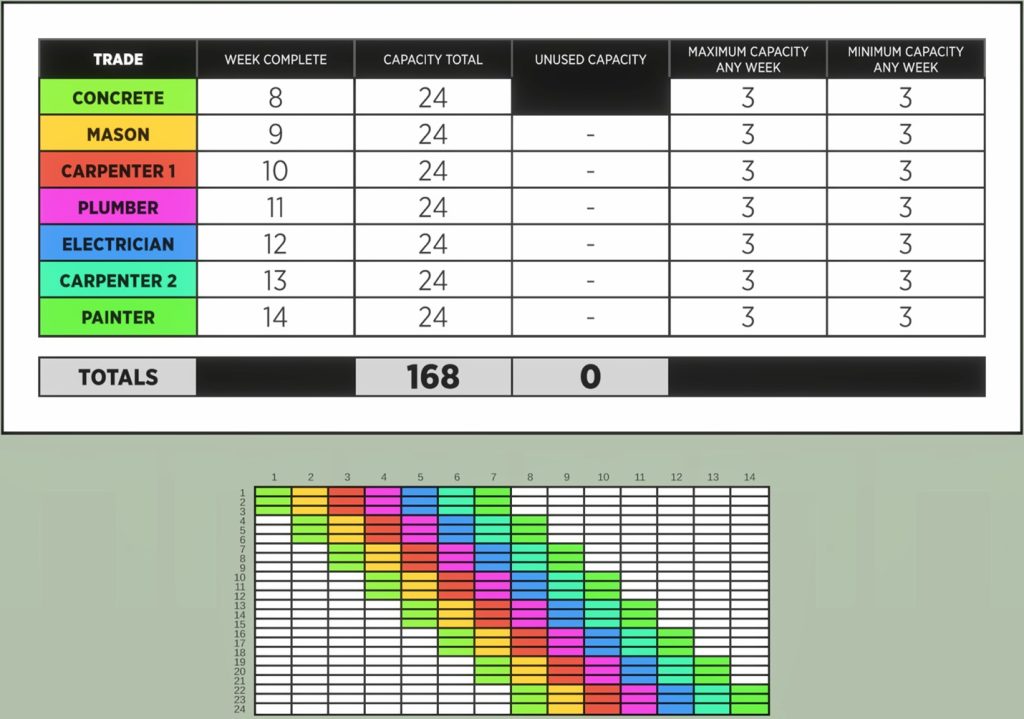
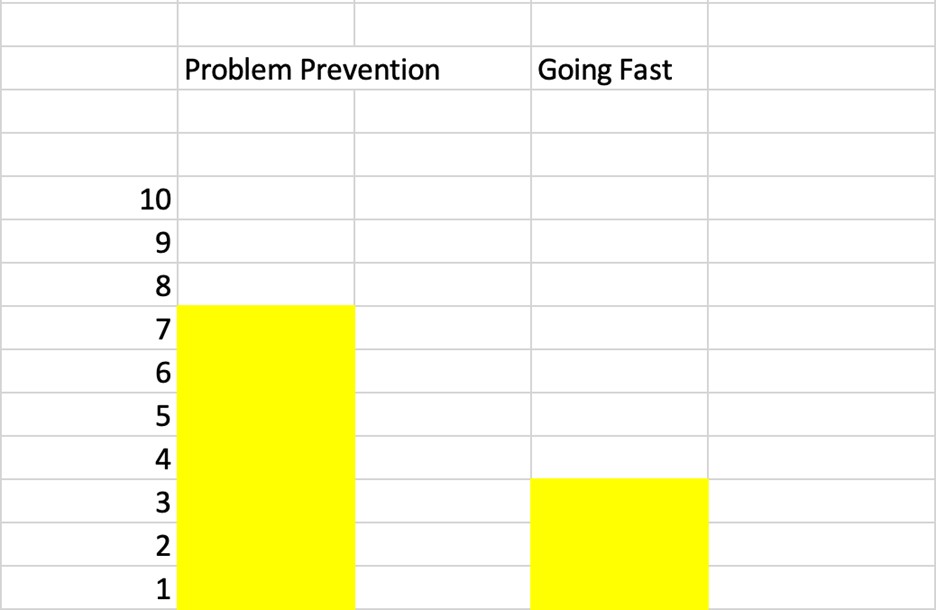
For this scenario, let’s plan on:
- Dice range 3-3.
- 3 units of energy used for push.
- 7 units of energy used for preparation.
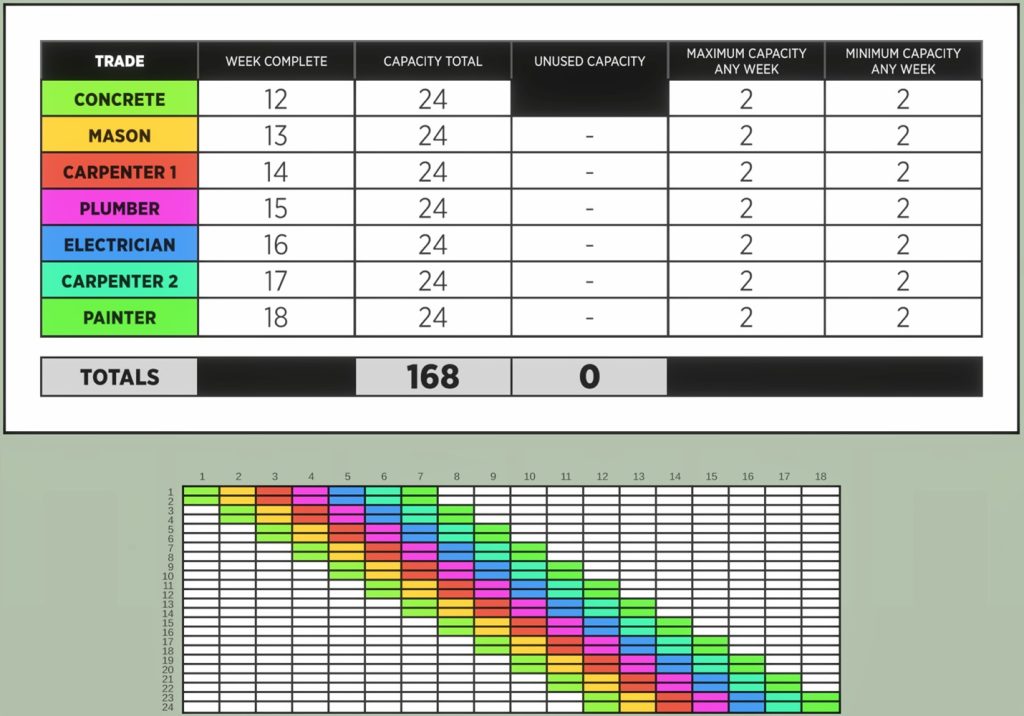
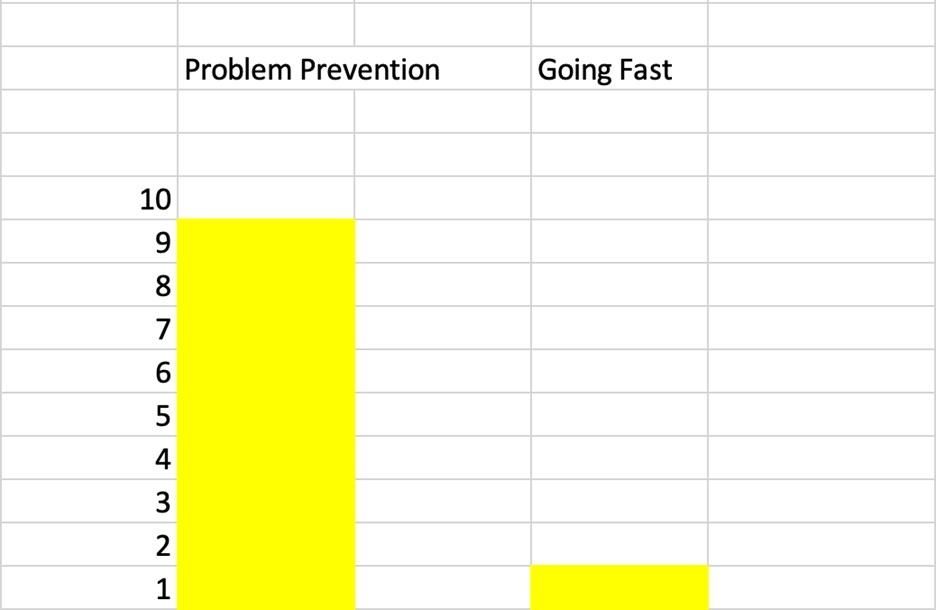
Fourth Scenario:
For this last scenario, let’s plan:
- Dice range 2-2.
- 1 unit of energy used for push.
- 9 units of energy used for preparation.
I ran all four rounds so you can see what happened.
Data Aggregation
To better aggregate the results, let’s look at this spreadsheet I made for us. The top shows the week complete, labor usage, and wage rate columns. The Total column uses the formula =sum(weeks*labor*wage*40). That means the amount of labor working 40 hours a week at that wage.
This is how the four rounds shook out: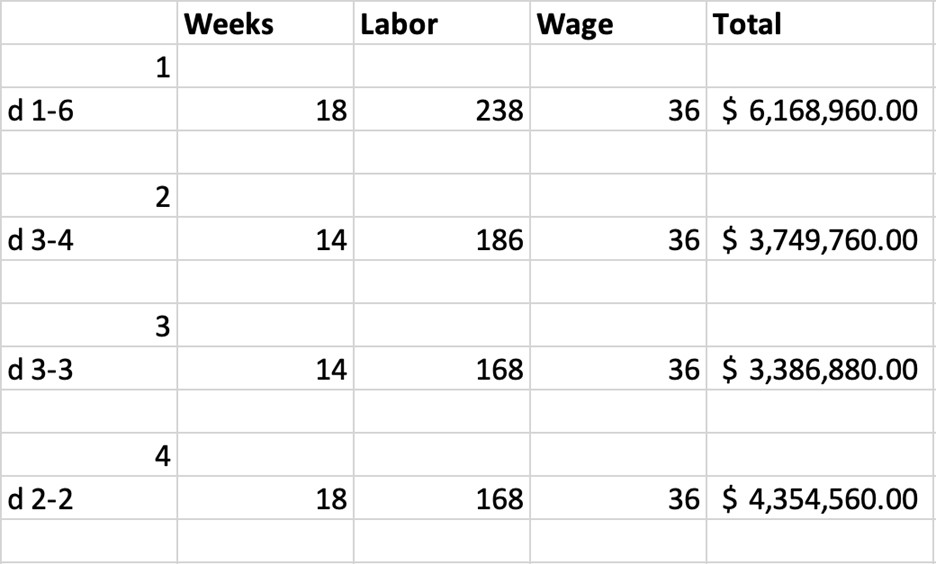
So, what do we learn from this?
- The more flow you have the better you end up.
- Pushing requires and wastes more labor.
- Slowing down the crews and spending more time in preparation reduces excess labor and costs.
- Going a perfectly even pace is the ideal situation.
- Even going super slow but consistent in the 2-2 scenario is the same duration as the 1-6, and it’s cheaper.
- Ultimately pushing costs $1,814,400.00 dollars more than the slow option. Why? Because the added 70 people needed to go fast with the 6s also stood around doing nothing during the 1s.
When I was taught to be superintendent, I was taught delays and slowdowns should be fixed by:
- Adding labor,
- Bringing materials faster,
- Pushing, and,
- Throwing money at the problem!
That is the exact opposite of what you should do.
If you experience delays, problems, and slowdowns, you should fix the problem, create stability, and flow!!
So, when you have a problem, please do the following:
- Remove roadblocks.
- Reduce the effect of constraints.
- Level procurement and bring materials JIT.
- Keep a consistent rhythm.
- Keep a clean, safe, and organized project.
- Improve team health.
- Spend more time preparing work.
- Increase training.
- Increase communication.
- Do work right the first time.
- Reduce variation.
Please do NOT do any of these:
- Throw labor at the problem.
- Add excess crews.
- Throw money at the problem.
- Rush large amounts of materials to the site.
- Make workers work too fast and too long.
- Work in unsafe and rushed conditions.
- Arbitrarily move up start dates.
- Become frantic.
- Work too much overtime.
- Have too many areas to work in.
- Work beyond training.
- Have a lack of breaks and buffers.
Speed comes from flow. > Flow comes from doing work the right way. > Doing work the right way only comes from a cool head that is not panicked.
Just remember, true builders do not push. They create flow with a sense of drive.
What you have seen simulated is Takt. Takt planning will get your crews going the same speed and the same distance apart. That is how you go fast—you flow.
Is your master scheduling system doing this for you? If not, what is the next step?

